Tampilkan postingan dengan label GDP. Tampilkan semua postingan

Rabu, 29 Februari 2012

Is the Q3 GDP growth rate of 6.1% a good or a bad number?

The short answer to the question: It depends on your viewpoint. Such a GDP growth number can not be seen in isolation, but in comparison with what has happened before and what is happening elsewhere.

Here are a few reasons why the number is good, and a few more reasons why the number is bad. The idea is not to confuse readers, but to provoke thinking and debate.

Reasons why Q3 GDP growth of 6.1% is good

If you look at the growth figures in some of the developed economies – particularly those in the Eurozone where even a 2% growth figure is considered gooda 6.1% growth figure should be celebrated with fireworks and champagne. The stark difference in growth figures is one of the reasons FIIs are investing big sums in our stock market.

High growth usually leads to inflation and therefore, high prices for goods and services. A more moderate growth figure has helped to tame inflation to a certain extent.

The Q4 GDP growth figure is unlikely to be much higher, but things are likely to improve from here on as there is usually a spurt in spending by the government sector to utilise left over funds from the previous year’s budget. In other words, the economic cycle may be bottoming out – which it usually does a few months after the stock market bottoms out.

Reasons why Q3 GDP growth of 6.1% is bad

This was the lowest growth figure in nearly 3 years, and almost 35% lower than the heady figure of 9.5% growth seen 5 years back.

There is evidence of economic slowdown everywhere – particularly in the manufacturing sector. Even services sector is slowing down. If growth doesn’t pick up soon, the FIIs may just pull out their money and invest it elsewhere.

Government’s fiscal deficit target for the year has already been exceeded in the first 10 months. That, coupled with the rise in oil prices, means that inflation may rear its ugly head again. The RBI may feel constrained to leave interest rates at the current high levels, or reduce it only marginally. That in turn will lead to slow growth in the next financial year.

Kamis, 12 Januari 2012

Why did the stock market fall despite a good IIP number?

India’s Nov 2011 IIP (Index of Industrial Production) came in at 5.9% – higher than the consensus estimate – raising hopes of a quick return to the growth path. Considering the Oct 2011 IIP of –5.1%, there was a huge 11% swing month-on-month.

The stock market should have celebrated by spiking higher – specially since both the Sensex and Nifty are in the midst of rallies from their recent bottoms. Instead of doing the obvious by rising, both indices lost ground. Not much, but enough to cause consternation among small investors.

What is going on? Is this just the way Mr Market behaves to separate investors from their hard-earned money?

There can be a few logical explanations, which are mentioned below:

1. Both the Sensex and Nifty are in the midst of prolonged bear markets. Good news tend to get ‘discounted’ quickly and bad news causes renewed selling during bear markets.

2. Infosys – which is generally considered to be one of the bellwethers of the Indian stock market – announced better than expected Q3 results, but disappointing Q4 guidance and got hammered. Its high weightage in both indices caused the fall.

3. Oct 2011 IIP number was unusually low – but one must remember that it was a festival month (Navratri and Diwali), which meant lower production days due to the holidays. Nov 2011 IIP was comparatively much better, but some of the new orders may be due to inventory replenishment. Lower growth usually leads to inventory draw-downs (companies tend to let their existing inventory get depleted almost completely before placing new orders).

4. Technically, both indices retreated after facing twin resistances from their 50 day EMAs and DTLs (refer last Sunday’s post on Sensex and Nifty chart patterns).

5. All of the above.

Stock markets don’t necessarily move according to logic. In the short-term, sentiments can, and often do, overrule the fundamentals. So can a rush of buying or selling by the FIIs. What should small investors do?

Remember an old saying: “Buy the rumour; sell on news.” There is no better example of that maxim than today’s price action in the TTK Prestige counter. The company announced impressive Q3 results, but the stock lost more than 7% after the ‘good news’!

The stock market is in a state of flux. After 14 months of down trend, small investors are becoming impatient to buy in the hope of a trend reversal soon. Please be aware that interest rate is still high. So is inflation – though food inflation has turned negative. Stock markets don’t reverse trend till the first few interest rate cuts happen.

There is a clamour for a CRR rate cut from all corners. If the Nov 2011 IIP figure is the reality, i.e. economic growth is back on track instead of what has been mentioned in point 3 above, then there is no reason for the RBI to cut the CRR – let alone cut the interest rate. A rate cut may stoke the inflation fire.

In other words, there is no need to turn bullish yet. Await Q3 results of the big guns and RBI’s policy announcement on Jan 24. You may miss the absolute bottom by being conservative, but in a bear market it is better to be safe than sorry.

Senin, 26 Desember 2011

Stock Index Chart Patterns – S&P 500 and FTSE 100 – Dec 23, ‘11

S&P 500 Index Chart

SnP500_Dec2311

In last week’s analysis, contradictory signals from the technical indicators of the S&P 500 index chart had signalled a week of consolidation before Christmas. Instead, the index took investors for a roller-coaster ride – closing at its lowest level for the month on Mon. Dec 19 ‘11 and then rallying above all three EMAs to its highest closing of the month on Fri. Dec 23 ‘11. A bullish pattern of higher tops and higher bottoms will get formed if the index manages to move above its Oct ‘11 top of 1293. Will it be able to do so?

The technical indicators are looking bullish, but there are signs of fatigue. The slow stochastic, which was falling towards its 50% level last week, turned around smartly and is about to enter its overbought zone. The MACD has climbed up above its signal line in positive territory. The RSI, which was rising above its 50% level last week, dropped below its mid-point before inching back above it. The ROC had dropped into the negative zone last week, but turned around to just about enter its positive zone.

Note that all four technical indicators are showing negative divergences. The S&P 500 closed at its highest level for the month and was just 2 points short of its intra-day high for the month, but the technical indicators reached much lower tops. Another concern for the bulls is the progressively lower volumes as the index rose higher – with Friday’s volume being the lowest of the month. It is difficult to sustain a rally with low volume support.

US economic news and indicators are still providing mixed signals. Q3 GDP growth estimate was revised down to 1.8%. There is hope that Q4 GDP growth will show improvement. Weekly rail traffic grew by 11.7% over the same week in 2010. Reuters/Univ. of Michigan survey showed an increase in consumer sentiment to 69.9 against 64.4 in Nov ‘11, but was 18% lower than its average level since 1978. Initial unemployment claims fell to 364,000. New orders for manufactured durable goods increased by 3.8%. New home sales increased by 1.6%, but the median price dropped. Not great figures, but not doom and gloom either.

FTSE 100 Index Chart

FTSE_Dec2311

The FTSE 100 index chart tried to follow the lead from the S&P 500, but was less successful in its efforts to reverse the bearish trend. The index dropped to its lowest level for the month on Tue. Dec 20 ‘11. The subsequent rally climbed above the 20 day and 50 day EMAs but stopped short of the 200 day EMA. A weekly close above the 5500 level was accompanied by very low volumes.

The technical indicators are looking weak. The slow stochastic dropped below its 50% level, and failed to get back into the bullish zone. The MACD slipped into negative territory before managing to scramble back into the positive zone. The RSI fell below its 50% level and remained there. The ROC tried valiantly to clamber back into positive territory but failed. Looks like the Santa Claus rally may be skating on thin ice.

The UK economic outlook continues to be bleak. Q3 GDP growth was revised upwards to 0.6%; but services sector output contracted by 0.7% in Oct ‘11. Q4 GDP may be poor, and a threat of recession is looming large. The current account deficit in Q3 ballooned to 15 Billion sterling - its widest since 1955.

Bottomline? Chart patterns of the S&P 500 and FTSE 100 indices embarked on Santa Claus rallies, but on low volumes. The possibility of the rallies continuing during the last week of the year can’t be ruled out. Bears may use the opportunity to sell. Buying can be considered only on clear breaks above Oct ‘11 tops.

Jumat, 16 Desember 2011

RBI pauses interest rate hikes – why did the stock market dive?

Stock markets and interest rates have a love-hate relationship. Markets love low interest rates, but detest high interest rates. ‘Low’ and ‘high’ are relative terms. As a very rough thumb rule, a Repo rate of 5% or lower can be taken as a ‘low’ rate; 7% or higher can be considered a ‘high’ rate.

In Jul ‘08, the Repo rate (the interest rate payable by commercial banks when they borrow money from the RBI) had peaked at 9% – more than 6 months into the previous bear market that lasted from Jan ‘08 to Mar ‘09. Thereafter, Repo rates and Reverse Repo rates (interest rates payable by RBI when they borrow money from commercial banks) were gradually reduced till the Repo rate hit a low of 4.75% in Apr ‘09.

By Mar ‘09, when the Repo rate was at 5%, the stock market reversed direction and started rising. The ‘lag’ effect of interest rate changes are evident from the above data. Bear markets start well before interest rates hit their peak; bull markets start before interest rates drop to the bottom.

The next increase in the Repo rate came only in Mar ‘10, when it was raised from 4.75% to 5%. The bull market was already a year old by then. Thereafter, 12 more rate increases – the last of them in Oct ‘11 – took the Repo rate to a high of 8.5%. By then, the bear market from the top of Nov ‘10 was almost a year old.

Why do stock markets hate high interest rates? Because the cost of doing business increases for every one, and profits take a hit. Capital expenditure is postponed, which hurts growth and in turn, hurts profits. When earnings decrease, EPS reduces. P/E ratios become higher, which induces selling of stocks and shifting of investments to bank fixed deposits at high rates.

Two months back, RBI last increased the Repo and the Reverse Repo rates by 25 basis points (0.25%). The stock market had expected the hike, but appeared to celebrate the news by moving up. That seemed to go against logic. Stock markets are supposed to hate high interest rates. What may have caused the celebration was a hint by the RBI that they may not raise rates further if inflation rate started to moderate.

Inflation rate has started to drop, though it continues to remain high. Food inflation has fallen quite remarkably – whether due to seasonal reasons or high ‘base effect’ or both. The high interest rates caused GDP growth to slow down and de-growth in IIP (Index of Industrial Production). So, it was no surprise that RBI left the interest rates unchanged, and hinted that rates may be lowered henceforth to spur growth. Instead of celebrating, the stock market dived – again appearing to defy logic.

What happened? Many market players had expected a cut in the CRR (Cash Reserve ratio – the percentage of total deposits that commercial banks have to maintain in cash) to inject more liquidity into the financial system. But a combination of an inflation rate that is still high and a fast depreciating Rupee against the US dollar may have forced RBI’s hand in keeping the CRR in tact. That perhaps caused disappointment that led to the sell-off today.

During a bear market, the slightest bit of ‘bad’ news causes a disproportionate amount of negative sentiment. Even if the news isn’t bad for the long-term but appears to be bad in the short-term gives a good enough reason to sell. The opposite happens in bull markets, when the slightest bit of ‘good’ news sends the stock indices soaring. That is an unlikely occurrence at least for another 6 months. Till interest rates are reduced significantly, the bulls will not return.

Related Post

Market celebrates RBI interest rate hike – why?

Kamis, 01 Desember 2011

Will FDI in retail be good or bad for India?

Let me make it clear at the outset that the people of India should respond to that question. Or, at least a small subset of the people of India who have access to the Internet and may read this post. In other words, you, dear reader, get a chance to voice your opinion.

An opinion based on gut feel, or hearsay, or belief does not count for much. So, I’m going to present some cold, hard facts (from a reasonably reliable though may be a biased source – the current Secretary General of FICCI – published in a newspaper article today). Please read the facts, and then decide.

1. The idea of FDI in retail was proposed by the NDA government 7 years back. (It also found a place in BJP’s election manifesto in 2009. Yes, the same BJP which is now making a song and dance about opposing it and stalling Parliament proceedings.) The UPA is finally taking steps to implement this important economic reform.

A very uncomfortable Yashwant Sinha, when cornered by a TV journalist about the above, said: “Lot of water has flown down the Ganges. I have become older and wiser.” (Why is it that people become wiser when they are no longer in power? It’s a rhetorical question – no need to answer it!)

2. The retail market is expected to double from its current size of $490 Billion to $1 Trillion over the next 20 years. The current share of organised retail (including foreign ones) is expected to quadruple from 4% to 16%. That means, the market size for the ‘kirana’ type stores will go up from the current $470 Billion to $840 Billion over the next two decades. (Forget about job losses!)

3. Large format retail stores with FDI will be permitted in cities and towns with a population of 10 Lakhs or more. About 53 such cities and towns will make the cut today. This number is expected to increase to 76 in the next 20 years. (Not likely to be a plunder of the country like the East India Company did.)

4. More than 30 Crore people are expected to migrate to urban locations from the hinterland over the next two decades. The ‘kirana’ stores are unlikely to be able to meet the extra demand or employ a significant percentage of the influx.

5. To maintain India’s GDP growth rate at 9%, 1.2 Crore additional jobs will need to be created every year for the next 15 years. Such a large number of jobs are unlikely to be created by manufacturing units (which rely more and more on automation) or IT services (which is reaching growth limits).

6. Despite presence of large format retail stores like Spencers, Big Bazaar, Reliance Fresh, Trends - ‘kirana’ stores haven’t gone out of business. Both small and big format stores are co-existing.

7. The real differentiator in retail business is not at the front-end, the actual stores where we go to buy clothes or lipstick or kitchenware. It is the back-end operations involving logistics, supply chain management and sophisticated computer systems. These require knowledge, experience and large investments.

Large format retailers in India have managed the front-end well, raising the shopping experiences of Indians. But they have fallen way short in the back-end operations.

You have the facts. Now, it is your turn to opine. Will FDI in multi-brand retail be good for India, or will it be bad?

Related Post

Is Organised Retail a Great Business or a Mediocre Business?

Senin, 28 November 2011

Stock Index Chart Patterns – S&P 500 and FTSE 100 – Nov 25, ‘11

S&P 500 Index Chart

SnP500_Nov2511 _ Triangle-001-001

The S&P 500 index chart had another lower close in the Thanksgiving holiday week. I had made the following comment last week: “ (the index) is likely to fall to about 1160 before one can expect some recovery.” As if on cue, the index closed the week at 1159. Some times technical analysis works like magic – but no sleight of hand here. The downward target was arrived at by drawing a line parallel to the upper boundary of the symmetrical triangle pattern (in yellow).

The sharp correction has brought the 20 day EMA down to the 50 day EMA. A cross below will be the final confirmation of a return to a bear market. The technical indicators are looking bearish to the point of being oversold. The slow stochastic is deep inside its oversold zone. The MACD is falling below its signal line into negative territory. The RSI is just above its oversold zone. The ROC is sliding deeper into the negative zone. A likely upward bounce may be used by the bears as a selling opportunity.

The US economy is taking baby steps towards recovery. Q3 corporate profits rose 11.4% on a YoY basis. Initial unemployment claims rose by 5000 to 393,000 but remained below the psychological 400,000 mark. Rail traffic rose about 2% YoY. Durable goods orders declined a bit. Same store retail sales grew 2.8% YoY. A double-dip recession seems unlikely, provided problems in China and the Eurozone don’t aggravate.

FTSE 100 Index Chart

FTSE_Nov2511 _ Triangle-001-001 

The FTSE 100 index chart broke below the descending triangle pattern (in yellow), as was expected last week, and touched an intra-day low of 5075 on Nov 25 ‘11. But it turned out to be a ‘reversal day’ (lower low, higher close), as the bulls were helped by short covering.

Sharp falls from a clearly visible bearish pattern are often followed by equally sharp pullbacks. At the time of writing, the index had gained 3%. But the dual resistance from the falling 20 day EMA and the lower boundary of the descending triangle may prove too strong. The break below the triangle was a selling opportunity. The pullback is another opportunity to sell.

The technical indicators are bearish, but showing signs of turning back from oversold conditions. The slow stochastic is in its oversold zone, but turning up. The MACD is still falling below its signal line in negative territory. The RSI stopped short of dropping into its oversold zone. The ROC is negative, but bounced up sharply.

The Paris-based OECD expects the UK economy to enter a double-dip recession with GDP  growth projected at only 0.5% in 2012. The Bank of England may need to increase its QE amount to promote growth. Cash-strapped companies are finding it difficult to hire, invest and get bank loans. The German bond issue flopped. Italy’s yields are rising to unsustainable levels. Eurozone worries remain.

Bottomline? The chart patterns of the S&P 500 and FTSE 100 indices have fallen deeper into bear markets, and may be heading towards their Oct ‘11 lows. At times like these, no action may be the best action. Preserve your cash.

Senin, 21 November 2011

Stock Index Chart Patterns – S&P 500 and FTSE 100 – Nov 18, ‘11

S&P 500 Index Chart

image

In last week’s analysis of the S&P 500 index chart pattern, I had observed a symmetrical triangle consolidation pattern. Since consolidation patterns tend to be continuation patterns and the index had entered the triangle from below, the expected break out was upwards. But triangles are often unreliable, so I had warned investors to trade with caution because a break out could occur in either direction.

On Thur. Nov 17 ‘11, the index broke downwards on the highest volumes of the week, and dropped below all three EMAs. The 20 day EMA - which had crossed above the 200 day EMA and raised hopes of a return to a bull market - has dropped back on to the long-term moving average. The 50 day EMA failed to get close to the 200 day EMA, let alone cross above it. Though the index managed to close above the 1200 level on a weekly basis, it is likely to fall to about 1160 before one can expect some recovery.

The technical indicators are looking quite bearish. The slow stochastic is about to enter its oversold zone. The MACD is barely positive, and is falling below its signal line. The RSI has dropped below the 50% level. The ROC failed to enter positive territory, and is sliding down. The bears are regaining control once again.

The US economy is finally sprouting some green shoots. October housing starts showed marginal improvement, and industrial production rose by 0.7% (an improvement over the 0.1% drop in September). Weekly unemployment claims fell to 388,000. These numbers are not worth celebrating by any means, but a sign that the tide may finally be turning. But the Eurozone debt problems remain a bearish overhang on the stock market.

FTSE 100 Index Chart

image

Last week, I had made the following comment about the FTSE 100 chart pattern:

“The index is consolidating within a triangle pattern, but it looks like a bearish descending triangle from which the likely break will be downwards.”

Unlike a symmetrical triangle that is unreliable in indicating the direction of the eventual break out, descending (and ascending) triangles typically break out through the horizontal side of the triangle.

The FTSE 100 made another futile effort to cross above the 200 day EMA, dropped below all three EMAs by the end of the week and just about managed to remain within the descending triangle. But the bears have prevailed as expected. At the time of writing this post, the index has dropped more than 125 points, and is likely to test its Oct ‘11 low in the near future.

The technical indicators are looking bearish. The slow stochastic and the RSI are about to fall into their oversold zones. The MACD is below its signal line, and on the verge of turning negative. The ROC is inside negative territory. More correction is on the cards.

The Bank of England has warned that the UK economy is grinding to a halt and has cut the GDP growth forecast for 2012 to 1% (from the previous forecast of 2%). Unseasonably warm weather has reduced offtake of winter garments in retail outlets. Change of guard in Greece, Italy and Spain has not removed the Eurozone debt problems. The  economic woes continue.

Bottomline? The chart patterns of the S&P 500 and FTSE 100 indices have technically slipped back into bear markets. Things may get worse before they get any better. Stay in cash, and wait for the selling to abate.

Selasa, 15 November 2011

Investing strategies in inflationary times – a guest post

The business channels and pink papers have been obsessive about high inflation in the Indian economy and the consequent rise in interest rates – and well they should be. The government doesn’t seem too perturbed about the deleterious effect that high inflation causes – not just to GDP growth, but also to the wallets of common citizens.

During such times, savings and investments may be farthest from people’s minds as they struggle to make both ends meet. However, there are some comparatively less risky investment opportunities that smart investors can avail of – and Nishit discusses them in this month’s guest post.

--------------------------------------------------------------------------------------------------------

Inflation is rising, cost of loan repayments (EMIs) is going up and jobs are getting lost. How does a common man deal with such a situation?

Government bond yields have almost reached 9%. This means interest rates may rise further in the times to come. EMIs may go up if the RBI hikes the Repo rate, which is currently at 8.5%. In the case of loans, it is best to pre-pay some amount rather than letting the tenure increase. Many people will not get a tenure extension if their tenure has reached the maximum limit of about 25 years.

This is a good time to lock in your savings in high yield fixed investments. Non Convertible Debentures of L&T Finance gives an yield of about 10%. Other fixed income investments like Bank FDs should be utilized to avail of high interest rates. A SIP can be started in a Gilt fund. The interest rate cycle is about to peak soon and Gilt funds are likely to give good returns.

The recently increased limit in PPF investments from Rs 70,000 to Rs 1 lakh, and the higher rate of PPF return of 8.6% is a wonderful opportunity and should be made use of by small investors.

The markets are headed downwards. This scenario is likely to remain till interest rates start moving down. At every decline to key support levels, one can add blue chip shares to the portfolio keeping a 5 years horizon in mind. Supports for the Nifty are at 4700, 4300 and 3700.

Gold as an investment can be looked at only when the previous high of US $1900 per oz is taken out, or near the support level of US $1600 per oz.

For astute investors, cash is king. In a slow GDP growth environment, if one is willing to put down cash then real estate as well as automobiles may be available at good discounts. Plummeting car sales indicate that good cars may soon get sold at discounts just to clear off the inventory and keep the assembly lines working.

This is a great time for an investor to build an entire new portfolio. The portfolio should comprise of fixed income instruments, stocks, commodities and real estate. A proper balance of allocation to these assets will generate wealth going forward.

--------------------------------------------------------------------------------------------------------

(Nishit Vadhavkar is a Quality Manager working at an IT MNC. Deciphering economics, equity markets and piercing the jargon to make it understandable to all is his passion. "We work hard for our money, our money should work even harder for us" is his motto.

Nishit blogs at Money Manthan.)

Senin, 14 November 2011

Stock Index Chart Patterns – S&P 500 and FTSE 100 – Nov 11, ‘11

S&P 500 Index Chart

image

The S&P 500 index chart had another weekly close above the 200 day EMA, and is consolidating within a small symmetrical triangle pattern. The likely break out from such a triangle is upwards, since consolidation patterns tend to be continuation patterns. But triangles are unreliable patterns, and the break out can be in either direction – so trade with caution.

The technical indicators are giving mixed signals, which isn’t unusual during periods of consolidation. The slow stochastic is just above the 50% level, but touched a lower bottom. The MACD is positive, but below its signal line. The RSI is at the 50% level. The ROC has climbed back into positive territory, after touching a lower bottom. The 20 day EMA is entangled with the 200 day EMA. The 50 day EMA is rising, but is still below the 200 day EMA. The index is technically in a bull market, but things may change in a hurry.

The economy is showing a few encouraging signs. Weekly jobless claims fell to 390,000 – below the psychological 400,000mark. University of Michigan’s Consumer Sentiment Index came in at 64.2 – its third straight monthly improvement, but still below the average level of 69.3 during the past five recessions. The dark clouds haven’t blown away altogether. Container traffic between Asia and USA declined 3.8% in Q3, the first decline since Q4 ‘09. Rising oil price is another concern.

FTSE 100 Index Chart

image

Last week’s trading ended with a slightly higher weekly close for the FTSE 100 index chart, but a failure to cross above the 200 day EMA. The index is consolidating within a triangle pattern, but it looks like a bearish descending triangle from which the likely break will be downwards. The 20 day and 50 day EMAs are still rising, but are below the 200 day EMA. The struggle by the FTSE 100 to re-enter a bull market continues.

The technical indicators are looking bearish. Both the slow stochastic and the RSI are below their 50% levels. The MACD is below its signal line, and falling in positive territory. The ROC is trying to climb back into the positive zone. The index is technically in a bear market.

Unemployment in the UK is at a 17 year high, and is expected to rise further. A double-dip recession may be avoided, but the GDP growth in 2012 is likely to be a paltry 1.2%, as per this article. British companies like Vodafone, Diageo, Dixons, Unilever are reeling from the crisis in the Eurozone. Change of leadership in Greece and Italy – both new Prime Ministers are Ivy League trained economists – may provide temporary succour to stock markets, but long-term concerns about their debt problems remain.

Bottomline? The chart patterns of the S&P 500 and FTSE 100 indices continued their respective struggles – the former to remain in a bull market; the latter to get out of a bear market. This isn’t a time to be aggressive or proactive. Passive optimism and capital preservation should be the strategy till the end of the year.

Senin, 07 November 2011

Stock Index Chart Patterns – S&P 500 and FTSE 100 – Nov 04, ‘11

S&P 500 Index Chart

image

Two weeks back, there were a few doubts whether the bears have been vanquished or not. Those doubts have now been removed. The S&P 500 index is trading comfortably above the 200 day EMA. The 20 day EMA has crossed above the 50 day EMA, and is about to cross above the 200 day EMA as well. Once the 50 day EMA climbs above the 200 day EMA, a return to the bull market will be confirmed.

The technical indicators are correcting overbought conditions, but remain bullish. The slow stochastic has dropped from its overbought zone, but remains above the 50% level. The MACD is positive and touching its signal line. The RSI dropped after touching the edge of its overbought zone, but has bounced up from the 50% level. The ROC has bounced up from the ‘0’ line, back into positive territory.

Note the positive divergences in all four technical indicators that preceded the sharp rally during Oct ‘11. The index dropped to a lower bottom, but all four technical indicators made higher bottoms.

The US GDP grew at an annualised rate of 2.5% in Q3 – nothing great, but growth nevertheless. The manufacturing PMI slipped to 50.8 in Oct ‘11 from 51.6 in Sep ‘11 – a sign of slowing expansion. Weekly unemployment claims were 397,000 – still high, but below the psychological 400,000 mark. Compared to the chaos in Europe, the US economy seems to be slowly grinding its way out of trouble.

FTSE 100 Index Chart

image

The FTSE 100 index chart tried to follow in the footsteps of the S&P 500 chart out of a bear market. But a brief foray above the 200 day EMA is all that it could manage so far. The index dropped below all three EMAs, and is currently facing resistance from the falling 200 day EMA.

The technical indicators are showing some weakness. The slow stochastic has slipped below the 50% level after dropping from the overbought zone. The MACD is touching its signal line, and has started sliding in positive territory. The RSI bounced up from its 50% level after touching its overbought zone. The ROC bounced back after dipping into negative territory, but is heading down again.

The chaos caused by last week’s Greek drama seems to be abating. They look all set to accept austerity measures to avail the debt bailout. The next big problem is likely to be Italy, where bond yields are reaching unrealistic proportions. UK’s Q3 GDP grew a miniscule 0.5%, while manufacturing PMI slipped to 47.4 in Oct ‘11 from 50.8 in Sep ‘11 – a sign of contraction. Looks like a long, hard winter ahead.

Bottomline? The chart patterns of the S&P 500 and FTSE 100 indices continued their surprisingly strong rallies, with brief forays above the 200 day EMAs. The S&P 500 is showing signs of returning to a bull market, thanks to an economy that is growing ever so slowly. The FTSE 100 may revert to a bear market as there are ominous signs that the UK economy may slip into a recession again. Remain stock specific. Unless Eurozone debt problems are resolved satisfactorily, there is no point in feeling too bullish.

Selasa, 25 Oktober 2011

Market celebrates RBI interest rate hike – why?

RBI increased the repo rate (at which it provides short-duration loans to banks) and the reverse repo rate (at which banks maintain short-duration deposits with the RBI) by 25 basis points each. The repo rate is now 8.5% and the reverse repo rate is now 7.5%. The CRR has been left unchanged at 6%.

With inflation remaining stubbornly high despite 12 rounds of rate increases since Mar 2010, it was widely expected that the RBI will increase the repo and reverse repo rates by 25 bps (0.25%) today. The market should have already discounted the rate hike. Why the buying celebration then? Was there some good news that the market liked?

Apparently, there were three. First, and most important, the RBI governor hinted at inflation rate moderating to 7% by Dec ‘11, in which case there will be no further rate hike at the end of the year. Moderation of inflation and a likely pause in the rate hike cycle was considered ‘good news’ by the market.

Also, for the first time ever, interest rate on savings bank accounts have been de-regulated. That means banks have the freedom to offer any interest rate on savings bank accounts that they deem fit. Last, but not the least, banks have been given the freedom to open branches in Tier-II through Tier-VI towns without prior permission.

Let us look a little more critically at each of these pieces of ‘good news’.

How will inflation suddenly moderate to 7% in less than 2 months when it has remained uncontrollably high for the past 20 months? Will food prices suddenly fall? Will government employees get less salary? Will politicians become honest and stop their looting? The answer is: none of the above.

The moderation will happen due to the ‘base effect’. Inflation was already high in Dec ‘10. So the YoY increase in Dec ‘11 will appear to be less. Actual prices that we pay will remain almost the same as now. There is also a possibility that diesel and kerosene prices will finally be increased if inflation does moderate. So, we may get back to square one.

What about the pause in the rate hike? Well, that won’t help much either. Better than bad isn’t necessarily good. As per RBI’s guidance, the GDP growth rate has been revised down from 8% to 7.6% in year ending Mar 2012. There are already signs of growth slowdown, which will be exacerbated by today’s rate hike. Unless interest rates start heading downwards, stock markets are unlikely to go up.

Is the saving bank interest rate de-regulation good news? Certainly not for banks. Their business has already been hampered by high interest rates – due to which loans have become dearer and term deposit rates have gone up. If interest rate on savings bank accounts is increased, it will be a direct hit on bank bottom lines.

As per the Economic Times, if savings bank interest rate is increased from the current 4% to 5%, then all the banks put together may need to pay out an additional interest of Rs 15,000 Crores, which may reduce the entire banking sector’s profitability by 13%.

Look at it another way. Savings bank account holders will collectively receive an extra Rs 15,000 Crores. What will they do with the sudden inflow? Why, spend most of it. Will that stoke the fires of inflation or not? You tell me!

SBI has the largest percentage of savings bank accounts among all banks (Yes Bank has the fewest) and will be affected the most by an increase in savings bank interest rate. The CMD went on record that SBI will not increase the savings bank interest rate. He also said that de-regulation means rates can also be reduced.

What about opening branches in small towns? It may help in financial inclusion of people living in remote areas where no bank branches exist. But if there was a lot of business potential in Tier-II through Tier-VI towns, banks would have sought permission to open branches there by now. By removing the red-tape of prior permission, the business potential of remote corners of the country is not going to increase overnight. But opening branches will add to the operating costs of banks.

The ‘good news’ doesn’t seem so good, does it? What was the reason for the buying today? It was a combination of short-covering and index management – today being early F&O ‘expiry day’ because of the Diwali holiday. The broader markets didn’t participate much in the rally.

Both the Nifty and the Sensex are poised at the upper end of their respective trading ranges of the past 11 weeks – with the huge gaps caused in Aug ‘11 remaining unfilled. Tread with caution.

Selasa, 11 Oktober 2011

Why long-term investors should look at the big picture

With the Sensex and Nifty indices stuck within trading ranges for more than a month, small investors are in a quandary. What to do next? Two days of sharp bounce from a bottom, and the urge to jump in and buy is almost uncontrollable. Three days of correction from a resistance level, and every one is worried about a 2008-like crash.

Getting worried and disturbed about short-term index gyrations only increases your blood pressure and clouds your decision making. Times like these are true tests of your investment mettle. In life, unplanned action is some times better than planned inaction. But, for building wealth through successful investing in the stock market, you should practice the discipline of planned inaction.

The inaction refers only to buying and selling of stocks. Reading annual reports, books and preparing buy/sell lists are part of the daily ritual of  long-term investors. What then is the big picture referred to in the headline? I’m not an economist, but here is my take on what is happening around us.

Thanks to the Internet and FIIs, our stock market is fully integrated with global markets. All the nonsense about decoupling because of our strong domestic market is just that – nonsense. So, keep an eye on what is happening in global markets. To keep readers updated, I regularly post about stock indices in the US, Europe and Asia. If you are not reading those posts, ask yourself: Why not?

Europe is in quite a mess due to a unified currency that is not helping profligate nations - like Greece, Italy, Spain, Portugal - that are deep in debt and have very little capabilities (or even intentions) of repaying that debt. They neither can print their own currencies, nor can they devalue their currencies. The only options are that a financially stronger economy like Germany, and perhaps the IMF, will bail them out to stop them from defaulting. But that is postponing the problem – not solving it.

Many Indian companies – particularly IT services companies – switched their export focus from the USA to Europe post the dot.com crash in 2001. Some have built up significant businesses in Europe, including acquisition of European companies. The economic mess in the Eurozone is going to affect their bottom lines for the next few years.

China is a wild card. For years, they have been far ahead of India in building world-class infrastructure and an export-led high-growth economy. But with global economies slowing down, China is desperately trying to re-focus on their domestic market. There is strong suspicion about their reported growth figures, and that is reflected in their sliding stock market. If they start cutting back on their commodity purchases, which has been sustaining the global commodities market and shipping businesses, a big crash in global stock markets may follow.

The USA is not on the verge of collapse – like they were three years back. The situation is grim, but not hopeless. There will be a lot of pain before their economy eventually turns around. But thanks to two rounds of quantitative easing, and significant belt-tightening, US corporations are sitting on a lot of cash. They haven’t curtailed spending on existing IT services, and there are signs that they may be spending more on new services. The strengthening dollar will add to the bottom lines of IT services and export companies.

Our over-dependence on oil imports will further add to our balance of payments problem. The government had introduced several populist measures to help the rural poor. Subsidies on diesel, kerosene, fertilisers have added to the fiscal deficit. Rampant corruption and scams, as well as high inflation are keeping FIIs away. Their inflows partly help in reducing the deficit.

However, our GDP continues to grow. Not at 8-9% but more like 6-7%, which is much better than almost every one else except China. That pretty much rules out a 2008-like crash in the Indian stock market. But it could take a while before we see new highs on the Sensex and Nifty.

The sensible approach will be to cut out the daily noise emanating from the business TV channels, and concentrate on companies that have capable and trustworthy managements, and have records of several years of good performances through bull and bear cycles. If they produce goods or services that find buyers regardless of the state of the economy, so much the better. Companies that sell toothpaste, cigarettes, soaps and detergents, biscuits, life-saving drugs, drugs for chronic diseases, tractors, power tillers, tea and coffee will continue to do well.

Just remember that the stocks that don’t fall much during a down trend, don’t rise much during the subsequent up trend. The ones that fall more, tend to rise more. Of course, this ‘rule’ works only for well-managed companies.

Selasa, 30 Agustus 2011

Notes from the USA (Aug 2011) – a guest post

Going through last month’s introduction to KKP’s guest post gave me a sense of deja vu. More fear-mongering from the TV channels – this time about hurricane Irene. Flashlights, batteries, drills were flying off the shelves at Sears. Home Depot had set up a ‘command center’ with a large number of computer terminals and phones (reminded me of the NASA command center!) to ensure customer requests from the entire east coast could be attended to, and supplies provided immediately through a fleet of trucks on standby.

Doomsday stories about the economy got relegated to the back pages after the damp squib from Bernanke. But KKP thinks that the economic situation is of genuine concern, with a possible relapse into a recession. At best, it might turn into stagflation – where inflation remains low, but low interest rates do not attract enough spending.

---------------------------------------------------------------------------------------

Why is US Economic Data CRITICAL to our Financial Health?

I’m sharing a lot of information from multiple angles here…..Pay close attention since the picture is saying a 1000 words below.

A lot of readers of Subhankar’s blog might not realize it but the big-dog still is the $15Trillion engine in the US that continues to spend beyond their means every year. This is ‘huge’, and ‘unparalleled’ to any other economy. Until there are other economies that ‘spend’ as much as a percentage of GDP, AND, import it from other nations, it is going to be really hard to avoid the cold, sneeze and flu linkages (‘when US gets a cold, rest of the world gets a flu’ syndrome).

Just look at the statistics of how many people earned more than $200K per year in income! Four million tax returns showed income more than $200K per year. 26% of the big-tax-paying-people of the full US population earned $2Trillion in sum-total. This is a wealthy nation currently, and hence very spoiled with the spending patterns, debt levels, and problems arising are also of significant proportion/magnitude. Expenses are relatively low for the basic needs; in my area, milk is still $2.25 per gallon, gasoline is $3.50 per gallon, 2 piece sofa is $599, 42” LCD TV costs $399, mid-size car costs $16,000, good pant/shirt combo is $25, vegetables are $0.39-$1.50 per pound, and finally, cost of school is approx. $300 per year (housing taxes pay for school).

clip_image001

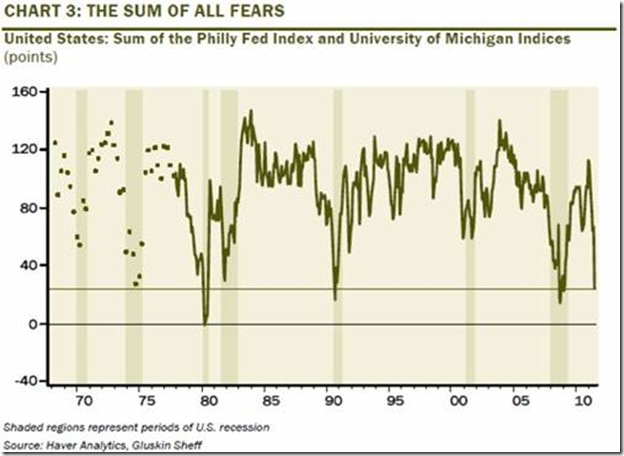
In researching the cause and effects, and the current state of the economy, I came across a unique chart that sums up the PFI (Philly Fed Index) and UoM (University of Michigan) Index. This chart is very interesting and thought provoking on what is coming down in the near future - especially if you map it to the previous recessions/slow-downs.
clip_image002

The Bureau of Economic Analysis's (BEA) second estimate of second quarter 2011 U.S. Gross Domestic Product (GDP) was reported to be 0.98%, continuing their recent trend of revising previously reported economic growth rates down. As a quick reminder, the classic definition of the GDP can be summarized with the following equation:

GDP = Private Consumption + Gross Private Investment + Government Spending + (Exports − Imports)

So, we are entering the phase of a recessionary time and we need to brace ourselves. I have been talking about this slow down since I just do NOT see:

  • Job market improving
  • Salaries improving
  • Corporate spending improving
  • Attitude of corporate buyers still very conservative
  • Housing market pretty much in doldrums / recession
  • Investors talking about ‘what to buy’
  • Investment choices in the market improving
  • Commodities still grabbing market share of available funds
  • IPO market improving
  • Consumers opening their purses to spend ‘openly’

Housing is still terrible. Existing-home sales were bad recently. The inventory of homes-for-sale grew, even as mortgage rates are at all-time lows. A 30-year mortgage is at 4.15%. It is possible we could see a 30-year mortgage with a “3” handle if we slip into recession. That is going to really help since it will reduce the mortgage payments for a lot of people. It is too common to hold mortgages on houses even if you are 60 years old!

clip_image002[4]

If you follow the curve above, you will clearly see the Activity index going down into the deep end, and therefore, we will see the effect of this in a lower to negative GDP very soon in 2011.

The above chart is a good predictor of the recessions, along with the Laxman Achutan ECRI report that I have posted previously. Even the ECRI noted that it was because two of the financial components added to the positive numbers there seemed to be a temporary positive effect. One was the sharp rise in M2 money supply. But a lot of that is because people are going to cash (I am present in this list as a micro-drop), which is not all that positive from a macro viewpoint. The other is the steepness of the yield curve, which is being manipulated at the short end. But, the key is yield curve is inverted, and inverted yield curves are a perfect venue to predicting a recession. Without these temporary positive contributions, the index would be down and, down three of the last four months, and in a pattern that led to a recession in late 2007.

clip_image002[6]

US is all about driving around for everything since it is so large and geographically dispersed without the appropriate rail/bus system (outside of the top 100 cities). It is not unusual to drive 50 to 75 miles per day to get to job and back, with the average of 12,000 to 16,000 miles per year per person (not family). Therefore, above curve down in the chart shows the true effects of the loss of jobs, which reduces the number of cars on the road and shows the reduction in activity, consumption and therefore, justifiably a lower GDP on the cards in 2011-12.

For investors around the world, this is a sign of worry that needs to be treated seriously. I have been talking about it and reflecting in my portfolio holdings (mostly in non-US currencies, fixed income investments, and a handful of small dividend paying instruments in the US). For the Indian portfolio, it is pretty much 30%-40% in cash holding, with the rest of them being part of a long term (hold) portfolio.

What do you think about your own financial health situation in 2011 and 2012?

---------------------------------------------------------------------------------------

KKP (Kiran Patel) is a long time investor in the US, investing in US, Indian and Chinese markets for the last 25 years. Investing is a passion, and most recently he has ventured into real estate in the US and also a bit in India. Running user groups, teaching kids at local high school, moderating a group in the US and running Investment Clubs are his current hobbies. He also works full time for a Fortune 100 corporation.

Senin, 08 Agustus 2011

Stock Index Chart Patterns – S&P 500 and FTSE 100 – Aug 05, ‘11

S&P 500 Index Chart

image

The S&P 500 index chart pattern cascaded down like a waterfall – first below the rising 200 day EMA, and then below the lower boundary of the trading range between 1250 and 1370. Stop-losses got triggered and margin calls led to panic selling. At the time of writing this post, the S&P 500 is trading at levels not seen since Oct ‘10.

Probable causes of the crash were flying around – Eurozone debt crisis, a last minute face-saving formula for raising the debt limit, downgrade of US credit rating from AAA to AA+, withdrawal of QE2. But the bull market had lost its fizz and was trading sideways within a 120 points range for 6 months. It finally fell due to its own weight.

The technical indicators are looking oversold, with the slow stochastic and RSI in their oversold zones, and the MACD deep in negative territory. Such sharp falls are usually followed by an upward bounce. If you are still invested, use the likely bounce to exit.

The US economy is still making painfully slow progress. 154000 non-farm payroll jobs were added in the private sector in July ‘11, but 37000 government jobs were lost. The weekly leading index (WLI) growth indicator of ECRI rose marginally to 2.1 from 2.0. The PMI index dropped from 55.3 to 50.9. Below 50 would mean a contracting manufacturing sector. The GDP growth in the first half of 2011 was just 0.4%.

FTSE 100 Index Chart

image

In last week’s analysis, the technical indicators had hinted that the FTSE 100 index chart will not be able to cling on to the support from its 200 day EMA for long. The sharp sell-off on increasing volumes pushed the index well below its 6 months long trading range between 5600 and 6100.

The ‘death cross’ of the 50 day EMA below the 200 day EMA will confirm a bear market. The technical indicators are very bearish, pointing to a deeper correction. The slow stochastic and RSI are in their oversold zones. The MACD is well inside negative territory. Use any upward bounce to sell – if you haven’t done so when the 5600 level was breached.

A lower-than-expected GDP growth rate of 1.3% in 2011, weakening employment, and muted consumer spending may push UK’s sluggish economy into a double-dip recession - as per this article.

Bottomline? The chart patterns of S&P 500 and FTSE 100 indices are in danger of falling into bear markets. Panic selling is usually followed by a bounce up and then a gradual grinding down to lower levels. This is not a good time to bottom fish. Stay in cash.

Senin, 01 Agustus 2011

Stock Index Chart Patterns – S&P 500 and FTSE 100 – Jul 29, ‘11

S&P 500 Index Chart

image

The S&P 500 index chart dropped like a stone - almost to the 200 day EMA, thanks mainly to the uncertainty surrounding the debt ceiling wrangle in Washington DC. The ‘resolution’ of the self-made debt crisis over the weekend may cause a temporary relief rally, but market sentiment appears to have taken a hit.

The index is again trading below its 20 day and 50 day EMAs, and has formed a bearish pattern of lower tops and lower bottoms. In spite of the rising 200 day EMA, the S&P 500 has been trading within a sideways range between 1250 and 1370 for the past 6 months.

The technical indicators have weakened. The slow stochastic is about to enter its oversold zone. The MACD is below its signal line and about to slip into negative territory. The RSI is below the 50% level. The contours of the debt deal in Washington will determine market direction this week.

The economy continues to sputter without much movement. Initial unemployment claims edged below the 400,000 mark after 15 weeks. The AAII Sentiment Survey showed bullish sentiment at a 5 week low of 37.8%, and bearish sentiment at a 5 week high of 31.4%. The University of Michigan Consumer Sentiment index at 63.7 was the lowest since Mar ‘09. Q2 GDP growth was a paltry 1.3%.

FTSE 100 Index Chart

image

The technical indicators were flashing alarm signals last week. It came as no surprise when the FTSE 100 dropped below the 200 day EMA. The index just about managed to close at the level of the long-term moving average at the end of the week.

There may not be much respite for the bulls. The slow stochastic is below the 50% level and headed down. The MACD is below the signal line and barely positive. The RSI is below the 50% level. The good news is that the 200 day EMA is still rising, and the FTSE 100 index is trading within the six months long sideways range between 5600 and 6100.

The less said about the UK economic recovery, the better. Q2 GDP growth was a miniscule 0.2% – much below expectations. If growth falters any further, policymakers may not have many options left. The austerity measures are clearly not working.

Bottomline? The chart patterns of S&P 500 and FTSE 100 indices are trading sideways with a slight upward bias for the past 6 months. The respective economies are growing, but ever so slowly. Stay invested, with stop-losses at the lower edge of the respective trading ranges. The intrepid can choose to trade the ranges.

Kamis, 28 Juli 2011

Notes from the USA (Jul 2011) – a guest post

Michael Moore’s hard-hitting documentary, ‘Bowling for Columbine’, made an interesting point. The government and the TV channels do their best to keep Americans in a state of fear – so that they consume more! Remember the Y2K scare? Shelves of department stores were empty of water, canned food, torches, batteries, guns and a myriad other goods required for survival. People bought truck loads of the stuff. On Jan 1 2000 – nothing happened. No crash, no collapse. But a lot of goods consumed.

Following the economic downturn in 2008, a similar fear scenario played out across the USA. It was going to be worse than the 1929 depression. There would be riots on the streets. The US dollar was not going to be worth the paper it was printed on. Stock markets would crash and retirement benefits will vanish into thin air (a la Enron). Yes, unemployment is still high and the housing market is in doldrums. The doomsday theories have only led to a phenomenal rush to buy gold – but Americans are not getting fooled this time. They are tightening their belts – well some are – and digging in for the long haul.

In this month’s guest post, Kiran provides a ‘ground-zero’ report of the US economy.

------------------------------------------------------------------------------------------

Global Growth Slow, But Continues…

The global recovery from 2009-10 has broadened to encompass more enterprises, more countries and more elements that show aggregate demand. Improving labour market conditions in high-income countries and strongly expanding domestic demand in developing countries augurs well for a continued maturity of the recovery that is more than two years old.

The recovery here in the USA has gained strength over the past 8 to 12 months and shows signs of becoming more self-sustaining, although all of it has happened in an atmosphere of disbelief that it is real. Of course, Aug 2nd 2011 deadline for raising the debt limit being around the corner, makes this recovery a huge suspect in the minds of many without a Quantitative Easing – Part 3 (QE3). At this point, QE3 is not being discussed although Bernanke has hinted that he would be ready to pull it off if the situation warrants it. In the US, significant gains in levels of manufacturing and services activity, business re-investment and technology upgrades have helped improve conditions in U.S. labour and professional services markets. Most of the technology upgrades that we see are destined to either reduce labour costs, or reduce the current monthly expenditure (lower powered servers, more automation, VoIP, Telepresence, Call Center automation etc).

The recovery in Europe continues to face substantial uncertainty surrounding sovereign debt in several Eurozone members (code named PIIGS for each of the individual countries in huge debts). Germany and France have shown increasing strength; with unemployment in Germany now well below pre-crisis levels. In many other countries, growth is becoming constrained by fiscal consolidation programs, ongoing banking-sector restructuring and a skepticism regarding the financial sector. Perception is more important than reality, which is why gold is still trending upwards.

The horrible natural disaster and ensuing nuclear challenge in Japan will shape economic and human developments in that country for years to come. More importantly, all of the nuclear power plants in the US that are built similar to the one in Japan are under re-engineering to avoid a similar disaster. Despite the very real human and wealth losses associated with the crisis, its negative impact on GDP growth is expected to be temporary.

Overall, global growth is projected to ease from 3.8 percent in 2010 to 3.2 percent in 2011, before picking up to 3.6 percent in each of 2012 and 2013. The slowdown for high-income countries mainly reflects very weak growth in Japan due to the after-effects of the earthquake and tsunami. Japanese companies doing business worldwide are just starting to turn around and getting the business environment back to normal. Growth in the remaining high-income countries is expected to remain broadly stable at around 2.5 percent through 2013, despite a gradual withdrawal of the substantial fiscal and monetary stimulus introduced following the financial crisis to prevent a more serious downturn.

Contrary to the above, much of the rest of the world, meanwhile, is brimming with energy and hope. Policymakers in China, Brazil, India, and Turkey worry about too much growth, rather than too little. Rate increases in India and China are perfect proofs of efforts to curb inflation. By some measures, China is already the world’s largest economy, and emerging-market and developing countries account for more than half of the world’s output. The consulting firm McKinsey has christened Africa (part of the BRICA with the A standing for Africa), long synonymous with economic failure, as the land of “lions on the move.” That is an amazing turn for an economy – recall the pictures circulating on the Internet of kids who do not have water to drink and food to eat, and are just sitting there on the roadside. Well, a lot of that might be just a memory in Africa in the next decade.

Overall, for the cluster of developing countries growth is projected to decline from 7.3% to 6.2% between 2010 and 2012 before firming somewhat in 2013, reflecting an end to bounce-back factors that served to boost growth in 2010. The BRIC nations might have its own growth factors that are uniquely defined based on the organic growth within. Hence, their economies are more in the 8% to 10% GDP growth range, although inflation is a cause for concern in these hot economies. So, monetary tightening will continue to happen to temper the inflation.

Bringing it to today, perhaps for the first time in modern history, the future of the global economy lies in the hands of developing countries. The United States and Europe struggle on as wounded giants, casualties of the financial excesses and for the next few days, political paralysis. Economies of USA and Europe are shackled by heavy debt burdens with years of stagnation or slow growth in the offing and definitely a widening inequality – although they are not going to crash, contrary to emotional and eye catching dire predictions by some people. Analyzing the profile of family groups, and looking into their financial profiles, clearly shows the excesses in US from an income and asset standpoint. In the next one to two decades we will create ‘the haves’ and ‘the have nots’ even in these developed countries since the poor are getting poorer (with less and less government programs) and the rich will get richer buying more assets at low prices, for an eventual recovery. See below for a couple of interesting graphics:

clip_image002

clip_image002[5]

------------------------------------------------------------------------------------------

KKP (Kiran Patel) is a long time investor in the US, investing in US, Indian and Chinese markets for the last 25 years. Investing is a passion, and most recently he has ventured into real estate in the US and also a bit in India. Running user groups, teaching kids at local high school, moderating a group in the US and running Investment Clubs are his current hobbies. He also works full time for a Fortune 100 corporation.

Selasa, 03 Mei 2011

RBI raises interest rates – markets crash; what should investors do?

Regular readers of this blog should not have been too surprised by today’s selling, which followed the RBI announcement raising the repo and reverse repo rates by 50 bps (0.5%) each. In last Saturday’s analysis of the Nifty chart, I had mentioned the possibility:

‘The markets have already discounted a likely 25 bps interest rate hike by the RBI next week. If the actual hike is 50 bps, there can be more selling.’

The RBI governor had adopted a graduated raising of interest rates so far, taking baby steps of 25 bps on the past few occasions. Market players had expected a similar hike this time around, but were taken aback by the aggressive stance of the RBI. So, they decided to head towards the ‘Exit’ doors.

What signal is the RBI trying to convey? Inflation has now become a bigger concern than growth. It needs to be contained, even if growth slows down in the near term. Is that the right thing to do? What happens over the next few months will provide the answer to that question. Interest rate hikes take some time to percolate through the financial system.

The fact is, the earlier rate hikes of 25 bps at a time - in an effort to balance inflation and growth - has not really worked. Inflation continues to remain high, though it has reduced from double digits to single digit. The unrest in the Middle East caused a spike in oil prices that made the inflation situation even worse.

Thanks to the elections in a few states, petrol prices have not been raised. But they surely will be, once elections are over. Diesel, kerosene and cooking gas subsidies are huge burdens being borne by the oil marketing companies. At some point, diesel prices will need to be de-controlled. That will further stoke inflation.

The RBI governor decided to bite the bullet and tackle inflation with a heavier hand now. Higher interest rates will hinder the already slowing credit off-take and capex plans of India Inc. GDP growth in FY12 is expected in the 7.5% – 8% range. Not bad, but lower than earlier forecasts. Profit margins of India Inc. will reduce. That is why the sell-off happened today.

What should small investors do? Some times the best thing to do is to do nothing (and enjoy the extra 0.5% interest in your savings bank account that RBI doled out). Wait for the dust to settle, and the selling to subside. Then pick up some of the better stocks that may have been beaten up badly, and whose valuations start to look attractive.

Related Post

The Interest Rate hike was expected – why did the market fall?
Related Posts Plugin for WordPress, Blogger...